
WordPress can be fastest if managed properly but most beginners start with plugins which make life easier using WordPress not knowing the impact of such plugins on the performance ending up with a very high unstable configuration hitting the high loads on server and receiving emails from hosts suggesting switching over to higher plans for better managing the load.To take such a decision it is important to first identify what’s causing such a load on the server, if its just traffic ( which is very good ) or if the load spikes are without traffic then the cause could be something else which needs to be examined.
To identify whats causing the problem you need to install another plugin called P3 (Plugin Performance Profiler) which tracks the performance of all the installed and active plugins on the server.Its very easy to use, just Upload, Install and Activate the plugin.
Here are steps to do a test, for assessing the performance bottle necks in your WordPress Setup :
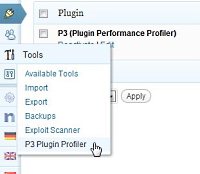
- After activation Go to the Plugins Settings Page which can be found under plugin under Tools –> P3 Plugin Profiler.
- Click the “ Start Scan ” button which should open the Performance Scan Window – from which the scanner will analyze the speed and resource usage of all active plugins on your website as various page are opened and as links are clicked in the blog.A Tip : try opening up different types of links like Post Pages, Category Pages, Archives, etc., so that there are various instances of different plugins running in the background which can make it a comprehensive report as to how much resources/time various plugins are taking.
- The scan be either Automatic or Manual.In the automatic mode the scanner generates some traffic on your site, monitors your site’s performance on the server, and in a Manual Mode the user needs to click links for tracking the performance.
- Once you have done navigating links from the performance window, Click the “ I’am Done ” button on the bottom right which should stop the test and the report get generated similar to the image below.


The 4 boxes give information about the number of active plugins while the test was running, the plugin load time per visit, the plugin impact on the total page load speed and finally the number of SQL Queries per visit.
Checkout Other Factor Affecting Performance Using :
The results are divided into 6 tabs for in depth analysis with various performance results.
RunTime By Plugin
This shows how much time each plugin is running, giving a easy to understand pie-chart showing the data.Mouse hover on the pie-diagram shows how much time the plugin was executing and a percentage of the total runtime.
Detailed Breakdown
This shows the time( in seconds) each component takes on a page like for ex., how much time each plugin is executing, the time the theme takes loading.The bar chart shows the results for various components and legend makes it easier to interpret.

The Simple TimeLine
This is also similar to the Detail Breakdown, but shows the results of only some 3 components which are WP Core system, Theme and Plugin.The image below shows the results of the 3 components, indicating that the theme ( at a point ) and plugins are taking the most time of the timeline.

Detailed TimeLine
This timeline gives a complete picture of all the components, plugins and how much time each components is getting executed.This graph below helps us identify that the plugin ( Post-Views ) is taking more time compared to other plugins.

SQL Query TimeLine
This graph shows the number of SQL Queries for each page opened link.

Advanced Metrics
This tab with various averages of different parameters like Site Load Time, Profile Load Time, Plugin Load Time, Number of function calls etc.,


Google considering PageSpeed as an important factor in rankings, this plugin by far is the easiest way to profile the performance of WordPress which can be affected by various plugins and installed themes and help identify the bottlenecks without much hassle.Do share your thoughts on this plugin and how your experience with this.


